Icon times
Sensex 54318.4
BSE  1344.6 (2.4%)
BSE 100 54318.4
NSE  1344.6 (2.4%)
BSE Mid Cap 54318.4
BSE  1344.6 (2.4%)
BSE Small Cap 54318.4
BSE  1344.6 (2.4%)
ic_analysis
Stock-o-meter-plus

Equity Research Tool & Stock Fundamental Analysis using Yadnya's FIVE-G Framework

₹ 11,999.00 / Year₹ 9,999.00 / Year

Stock-O-Meter Plus Features

If you are a long-term investor and invest in a company as a shareholder and not as a trader, then you don't need to look any further. Our stock-o-meter covers a very detailed analysis of companies. Our analysis gives you a complete overview of the company w.r.t. its sector, industry, competitors and an understanding of future prospects. We use Yadnya's FIVE-G framework for analyzing these stocks.

ic_analysis

Detailed
Analysis of 75+
Companies

ic_easily

Easy to understand,
consumption oriented

ic_videos

Access to 120+
videos & 40+ ebooks

ic_research

Min. 5 research
videos every month

ic_data

Access to 2000+
companies' Financial data

ic_methodology

Unique & transparent
methodology

ic_5g

Stock rating using
Yadnya's FIVE-G
framework

Yadnya's Proprietary FIVE-G Framework for Fundamental Analysis

Financials

Financials

Quarterly & Annual Results Analysis – Last 10 years, Ratio Analysis

Industry

Industry

Market Analysis & Growth, Competitor Analysis & Prospects

Valuation

Valuation

Share Performance & Valuation Analysis

Enterprise

Enterprise

Company Overview, 4Ps of Marketing, Market Share, Differentiators, SWOT

Governance

Governance

Company & Promoter's Story, Shareholding, Board Profile, CSR, Reviews & Awards

Frequently Asked Questions

What is the Stock-O-meter 'Plus' plan? How it is different from Free Stock-O-Meter?

Plus plan has lot of additional features and research. These are some of the additional features in the plus version - 

  1. Detailed Stock Research in video form.  Atleast 5 new videos every month.
  2. Stock Rating & Highlights as per Yadnya's FIVE-G framework
  3. Access to all old research (130+ videos)
  4. Stock ebooks and Economic Indicator Report
  5. Extra Features such as Stock News, Watchlist creation, Additional Stock Comparison

Yes. Once you subscribe, you get access to 130+ videos and 50+ ebooks.

No. It is a Fundmental Analysis based Stock Research platform useful for Long term investors. Complete analysis is done based on our FIVE-G framework. No Short term stock tips or short term chart based analysis is done. 

We do not give short term Target price or Buy/Sell/Hold recommendations as we are firm believer in Long Term Investing. We do analyse Stock based on Valuation parameter and do give our view and rating based on it, which will give you a good understanding if the stock is good to buy/sell or hold for long term or now.

We do take suggestions on Stock Research but it is very difficult to honour every request. Our internal research team decides on the stock for review & analysis. Please note, there is no personalized advice under this subscription.

Yes, you can comment on the company page OR you can also chat with our client support team through 'Talk to us' option in our Android & iOS app.

Yes, we do have Mobile App on Android & IOS which gives you easy access and notification of new uploads.

Being a Research Product and since you will get access to all our research (Old & New), we don't have Refund Policy. 

Diving headfirst into stock analysis for beginners can be tricky at times. One of the most common stock market analysis techniques is to study the price-to-earninga> ratio of the stocks carefully. Investors sought to compare a stock's P/E ratio to its competitors and the usual industry standards to determine its value. Another effective method is to use Invest Yadnya's stock market analysis tool, where you can get the fieldwork done for you in advance!

To invest in good stocks, there are few stock market indicators that you must keep in mind like: Rising profits of the company, Rising sales of the company, low liabilities, the stock is available at a bargain price, growing dividends (an investor's best friend), the growing market of the company or the company is in a field with a high barrier to entry. Other vital stock analysis indicators include: companies having a low political profile, the stock is optionable, or the stock in consideration is benefiting from favourable megatrends. These are a few good stock indicators which one must consider.

Stock evaluation is a process that demands your caution and application of mind. IT requires careful analysis and extensive research before jumping to the decision making process. One of the most common stock valuation techniques is the usual price to earnings ratio. If you are wondering how to evaluate India's stock, use our stock research tool & evaluate any stock quickly.

The stock analysis process can be a tricky subject for a beginner. One of the most common stock analysis techniques is to study the Price-to-Earnings ratio carefully. The investors use this figure to compare with those of the industry standards and its competitors. If you are wondering, how to analyse a stock before investing, adapt one of the quickest stock market analysis techniques, with Invest Yadnya's Stock-O-Meter Plus.

The price-to-earnings ratio, or P/E ratio, is often used for stock analysis. Typically, India's ideal PE ratio can help define a bad or a good PE ratio or indicate expensiveness. Still, stocks with a P/E ratio of 15 or below are generally considered cheap. In contrast, stocks with a number above 18 are considered to be expensive. For better enquiry on these numbers, you can access the world-class provided by Investyadnya and ace the investing game.

Recently Uploaded

premium Premium
free Free

What customers say about Stock-O-Meter Plus?

Download the App

  • Financial Goal Planning
  • Retirement Planning
  • Emergency / Contingency Planning
  • Budget and Risk Planning
  • Direct Chat with Financial Advisors
  • Access to our Stock-O-Meter
  • Access to Model Portfolios

Stock analysis is a method for investors and traders to make buying and selling decisions. By studying and evaluating past and current data, investors and traders attempt to gain an edge in the markets by making informed decisions.There are two basic types of stock analysis: fundamental analysis and technical analysis.

Fundamental analysis concentrates on data from sources, including financial records, economic reports, company assets, and market share. To conduct fundamental analysis on a public company or sector, investors and analysts typically analyze the metrics on a company's financial statements - balance sheet, income statement, cash flow statement, and footnotes. When running stock analysis on a company's financial statements, an analyst will usually be checking for the measure of a company's profitability, liquidity, solvency, efficiency, growth trajectory, and leverage. Different ratios can be used to determine how healthy a company is.

The second method of stock analysis is technical analysis. Technical analysis focuses on the study of past market action to predict future price movement. Technical analysts analyze the financial market as a whole and are primarily concerned with price and volume, as well as the demand and supply factors that move the market. Charts are a key tool for technical analysts as they show a graphical illustration of a stock's trend within a stated time period.

A mutual fund is a professionally managed investment fund that pools money from many investors to purchase securities. These investors may be retail or institutional in nature. Mutual funds have advantages and disadvantages compared to direct investing in individual securities. The primary advantages of mutual funds are that they provide economies of scale, a higher level of diversification, they provide liquidity, and they are managed by professional investors.

A financial plan may contain prospective financial statements, which are similar, but different, than a budget. Financial plans are the ENTIRE financial accounting overview of a company. Complete financial plans contain all periods and transaction types. It's a combination of the financial statements which independently only reflect a past, present, or future state of the company. Financial plans are the collection of the historical, present, and future financial statements;

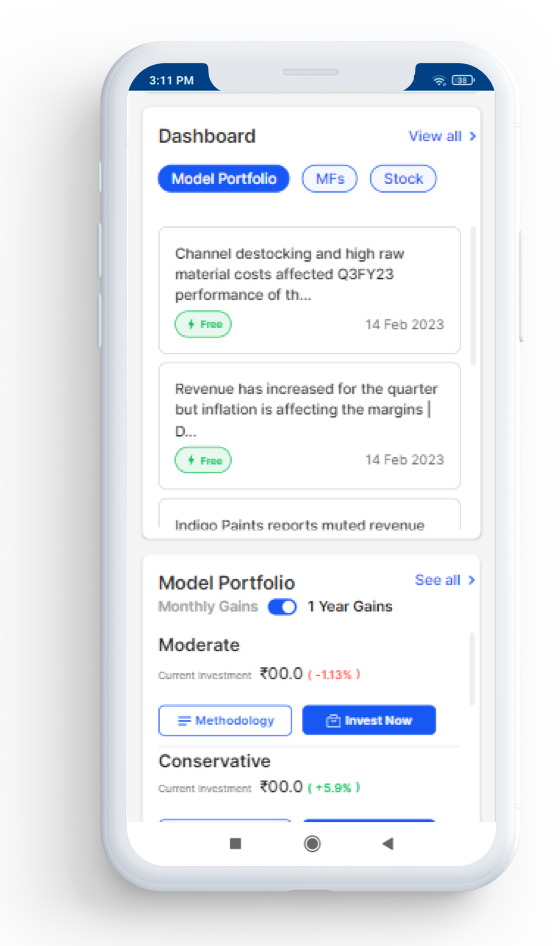
Look no further than our new model portfolios. Designed to make it easier for investors, these portfolios offer long term growth with a choice of Stocks, Actively managed Equity Funds, Index Funds/ETFs and Debt Funds. Portfolios are created separately for different risk profiles - Conservative, Moderate & Aggressive.

Chat on WhatsApp
Caret UP Arrow
InvestYadnya Support
Typically replies in minutes
InvestYadnya Support
Hi there
Welcome to InvestYadnya.
We are available to assist you on WhatsApp.
Please click on the button below to chat with us.
(10 AM to 7 PM IST)
16:10
Chat with InvestYadnya